Log in with RealMe

To access the Procurement online service, you need a RealMe login. If you've used a RealMe login somewhere else, you can use it here too. If you don't already have a username and password, just select "Log in" and choose to create one.

What's RealMe?

To log in to this service you need a RealMe login.

This service uses RealMe login to secure and protect your personal information.

RealMe login is a service from the New Zealand government that includes a single login, letting you use one username and password to access a wide range of services online.

Find out more at www.realme.govt.nz.

Workforce survey summary

Insights from the 2025 workforce survey.

In early 2025, we ran a cross-agency survey to understand the composition and capability of the procurement workforce across the public sector. This summary presents key findings from the 153 responses received and provides a snapshot of current workforce dynamics and emerging challenges.

Participation and coverage

A total of 153 responses were received from 76 organisations. Most respondents (63%) came from public service agencies and Crown entities. Nearly half (48%) were managers, including 21% who managed across multiple levels and 27% who were single-level people managers. Respondents were mostly female (63%), with 33% male and 4% who chose not to specify their gender.

Distribution of respondents


A pie graph showing the distribution of respondents to the workforce survey.

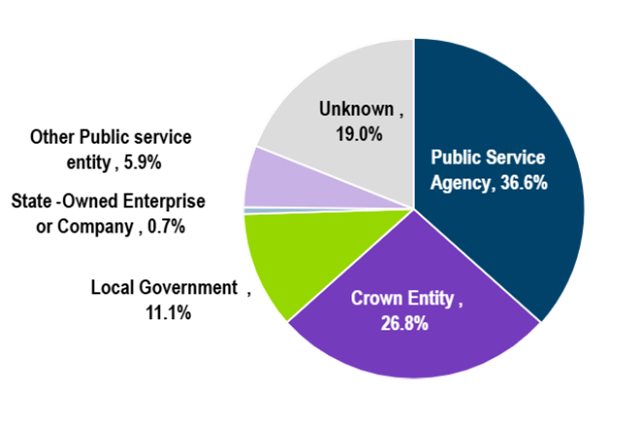
Distribution of respondents: Public Service Agency 36.6%, Crown Entity 26.8%, Unknown 19%, Local Government 11.1%, Other Public service entity 5.9%, State-Owned Enterprise or Company 0.7%.


Workforce composition and tenure

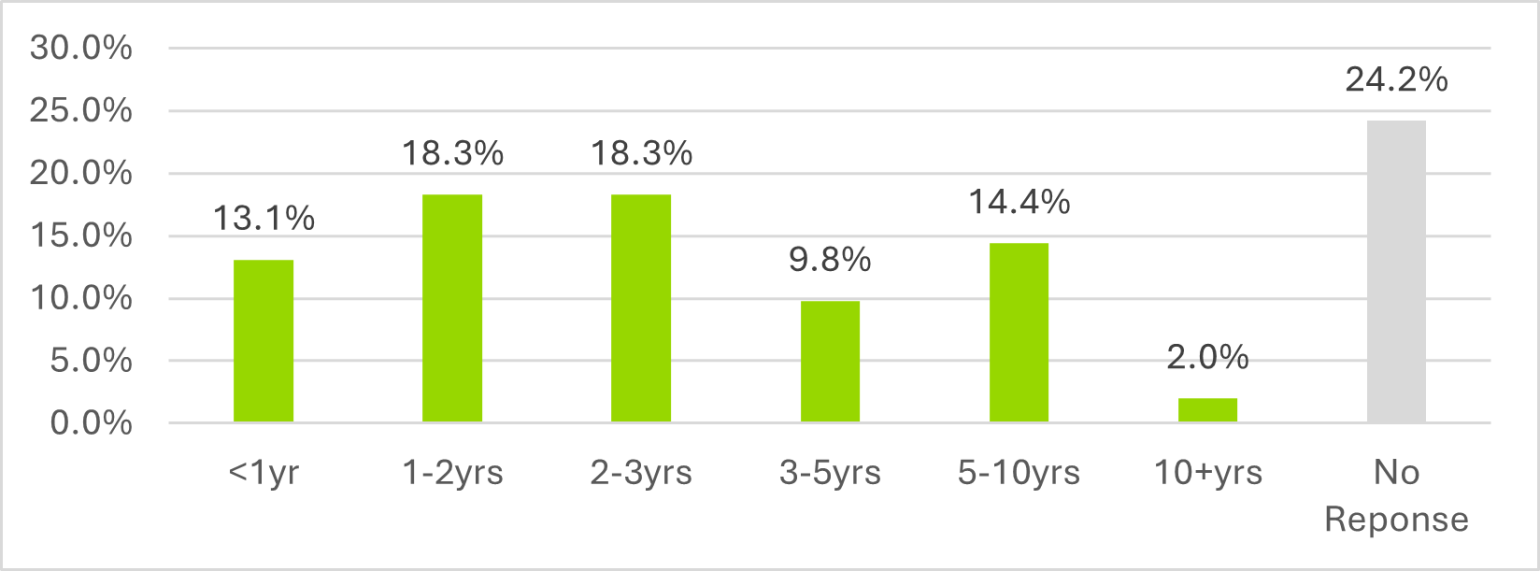
Most respondents were relatively new to their roles, with 36% having been in their current position for one to three years. Procurement was commonly a mid career choice, with 69% entering the field later in their working lives and 71% aged over 40. Career mobility within procurement was also evident, as 37% had held between 2 and 5 different procurement roles. Experience varied across sectors, with 40% having worked only in the public sector, while 30% had procurement experience spanning both the public and private sectors.

Current role tenure

workforce survey current role tenure
This graph compares how long respondents have been in their role.

Text description of graph data – Current role tenure

Time of tenure

Percentage

Less than 1 year

13.1%

1 to 2 years 18.3%
2 to 3 years 18.3%
3 to 5 years 9.8%
5 to 10 years 14.4%
More than 10 years 2%
No response 24.2%


Experience and qualifications

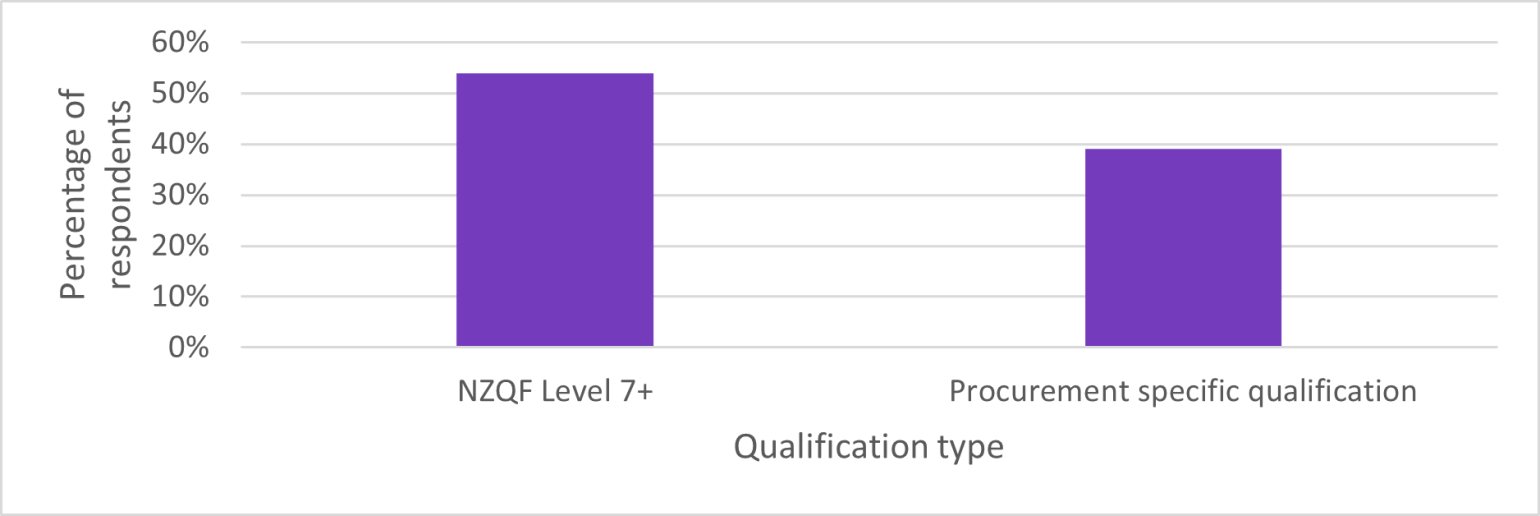
The survey shows a highly skilled procurement workforce. Just over half of respondents (54%) hold NZQF Level 7 or higher qualifications, and 39% have procurement specific credentials. Most respondents (56%) also bring 5 or more years of experience, suggesting a mature and knowledgeable profession.

Qualification type

workforce survey qualifications
This graph shows 54% of survey respondents hold NZQF Level 7 or higher qualifications, and 39% have procurement specific credentials.

Capability and learning needs

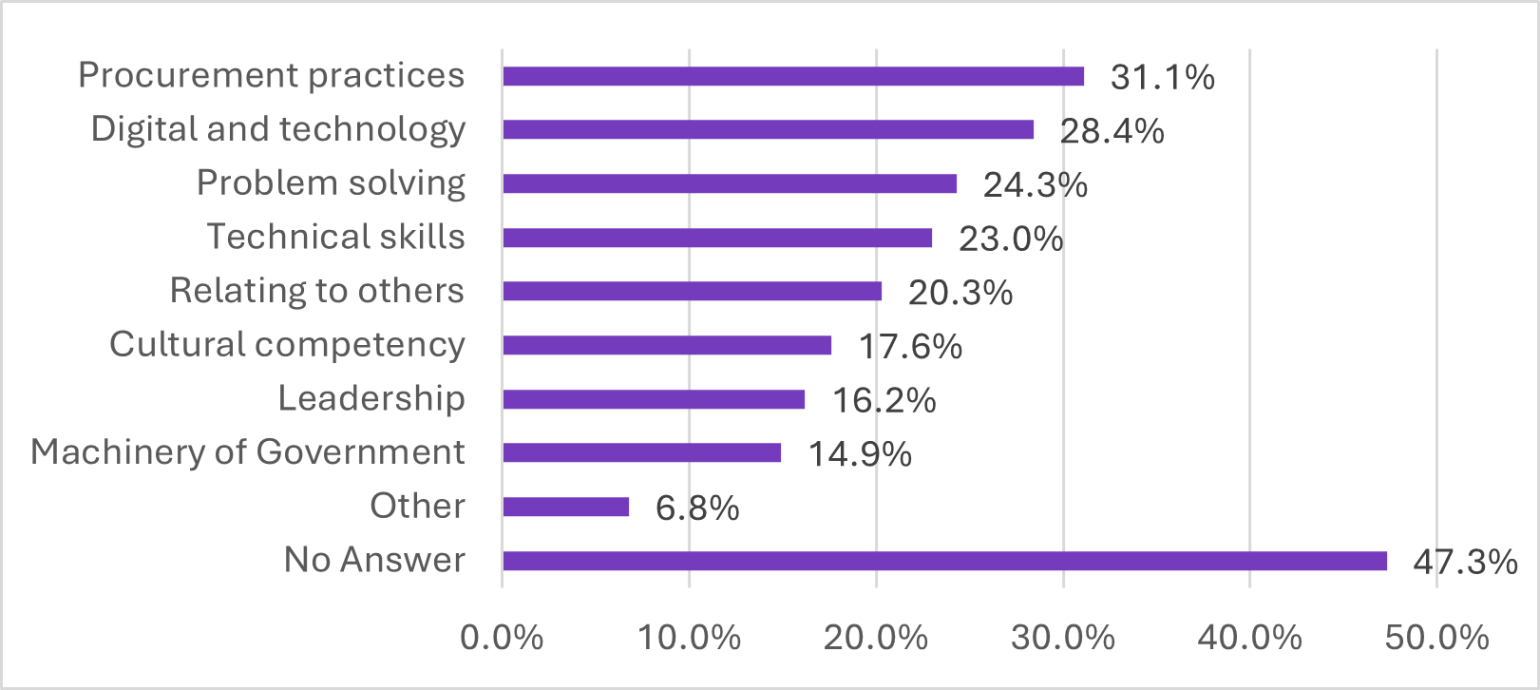
Over half of managers (53%) reported skills gaps, particularly in procurement practices and in digital and technology capability. Both managers and staff identified 3 shared priority areas for further development: market analysis and supplier research, dispute resolution, and the use of procurement software.

Skills gaps identified by managers

workforce survey skills gaps by managers
This graph compares the skill gaps identified by managers.

Text description of graph data – Skills gaps identified by managers

Skills gaps

Percentage

Procurement practices

31.1%

Digital and technology 28.4%
Problem solving 24.3%
Technical skills 23%
Relating to others 20.3%
Cultural competency 17.6%
Leadership 16.2%
Machinery of Government 14.9%
Other 6.8%
No answer 47.3%

Training

Just over a third of respondents (34.6%) completed training in the past year. External providers were used by 27% of managers, with CIPS and World Commerce & Contracting the most common choices.

Almost half of respondents (48%) engaged with Hīkina training materials or workshops, and 93% of those found the training useful.

Additionally, 42% of managers reported having at least one team member enrolled in formal procurement training or working towards accreditation.

Staffing needs and shortages

Over half of participating managers (55%) reported no current staffing shortages. Staff turnover varied, with 38% of managers experiencing 1 to 4 direct reports leaving in the past year and just over 1% reporting 5 to 10 departures. Most vacancies were filled from outside the organisation, with 70% of hires made through external recruitment.

Staffing demand over the next 12 months

workforce survey near term staffing demand
This graph shows staffing demand over the next 12 months reported by participating managers – 42% report a demand of 1 to 4 full-time employees, and 35% report a demand of 5 or more full-time employees.

Contractor use

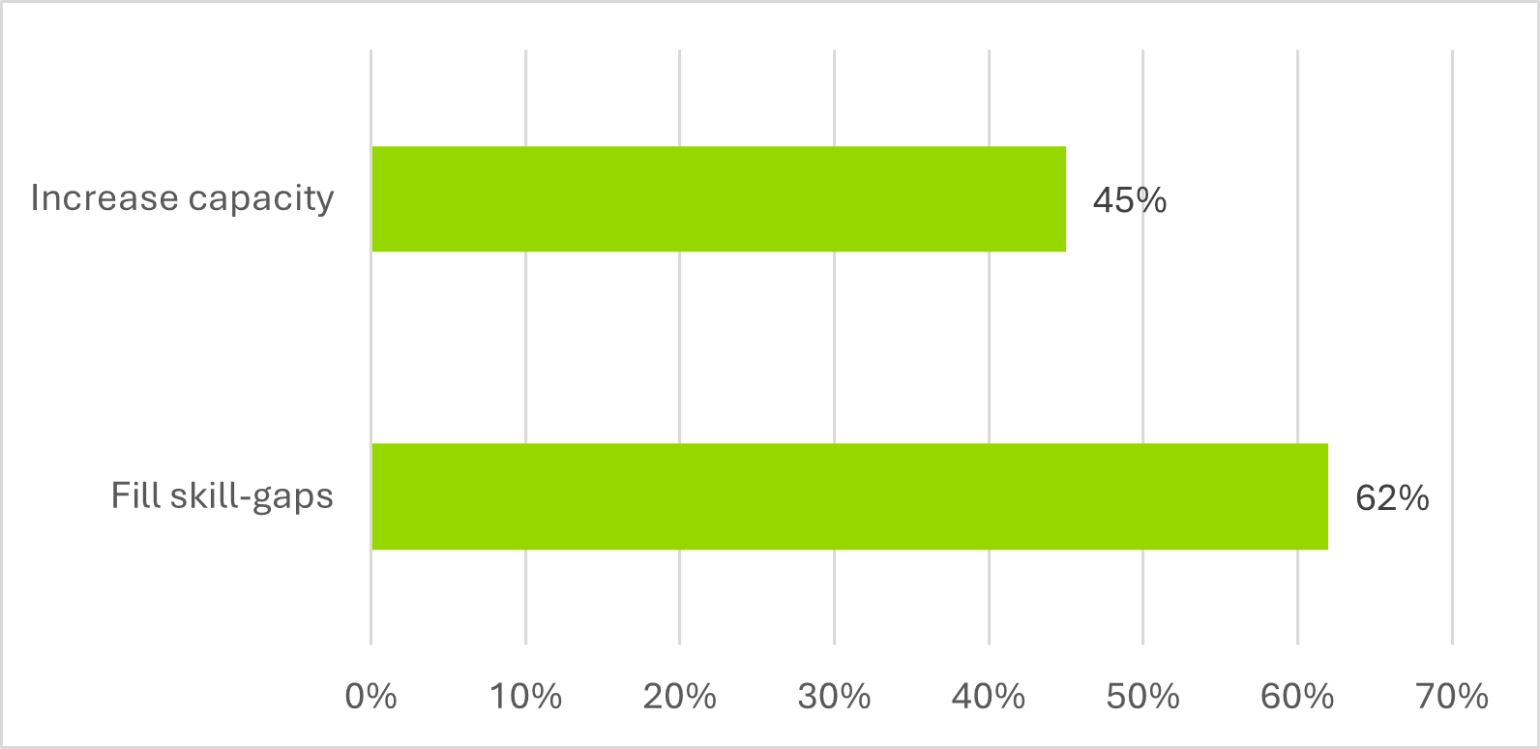
Nearly 4 in 10 managers (39%) hired contractors over the past year. The main drivers were skill shortages (62%) and limited staff availability (45%). Most contractors were engaged for short periods, with 76% hired on contracts of less than 12 months and 41% on contracts shorter than six months.

Reason for hiring contractors

workforce survey reasons for hiring a contractor
This graph compares the reasons for hiring contractors – 62% were to fill skill gaps and 45% were to increase capacity.

Satisfaction and culture

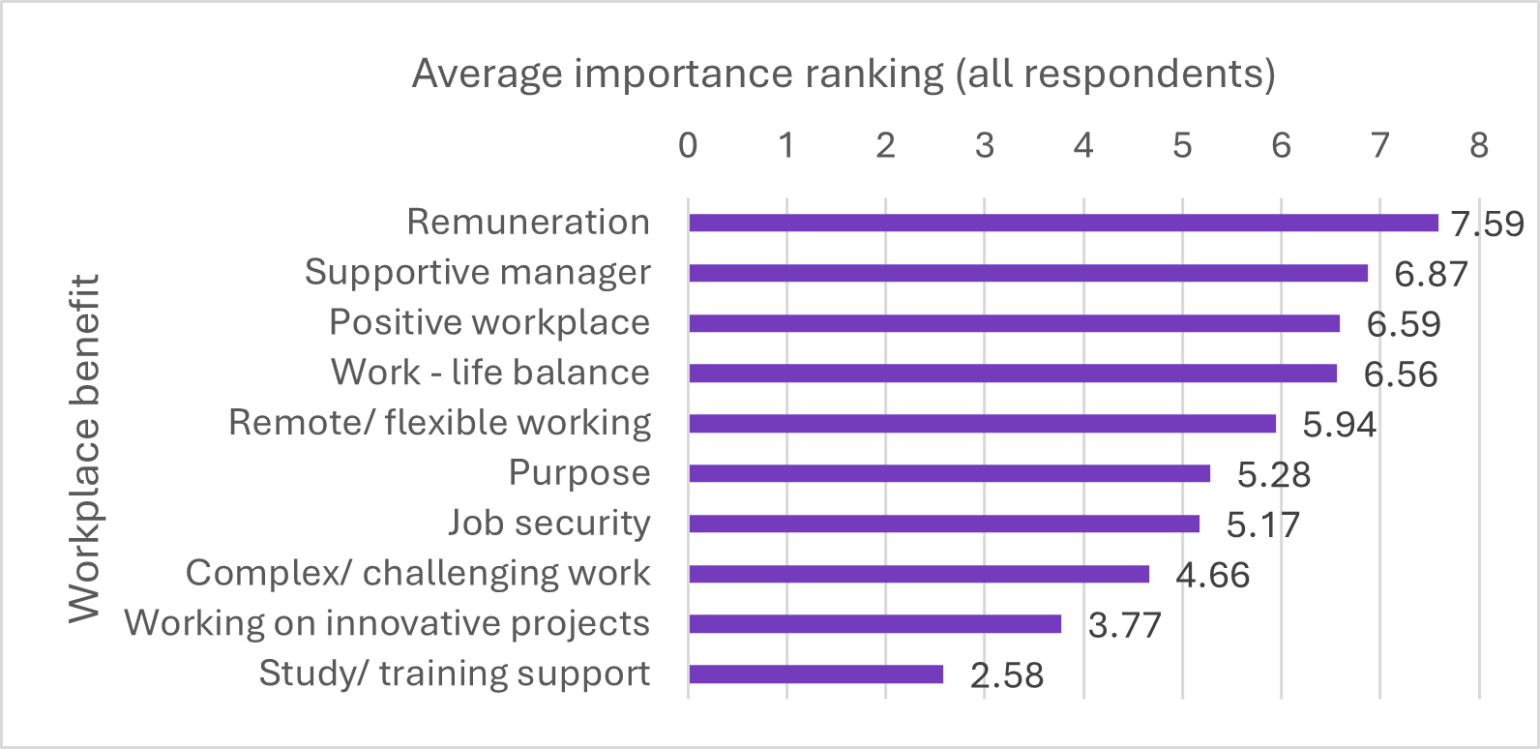
Most respondents were positive about their roles, with 58% reporting job satisfaction. Remuneration was rated as the most valued benefit, scoring 7.59 out of 10. Other key benefits included having a supportive manager, a positive work culture, and good work-life balance.

Ranking of workplace benefits

workforce survey average importance ranking
This graph shows the average importance respondents place on workplace benefits.

Text description of graph data – Ranking of workplace benefits

Workplace benefit

Ranking out of 10

Remuneration

7.59

Supportive manager  6.87
Positive workplace 6.59
Work-life balance 6.56
Remote/ flexible working 5.94
Purpose 5.28
Job security 5.17
Complex/ challenging work  4.66
Work on innovative projects 3.77
Study/ training support 2.58

Survey participation and diversity

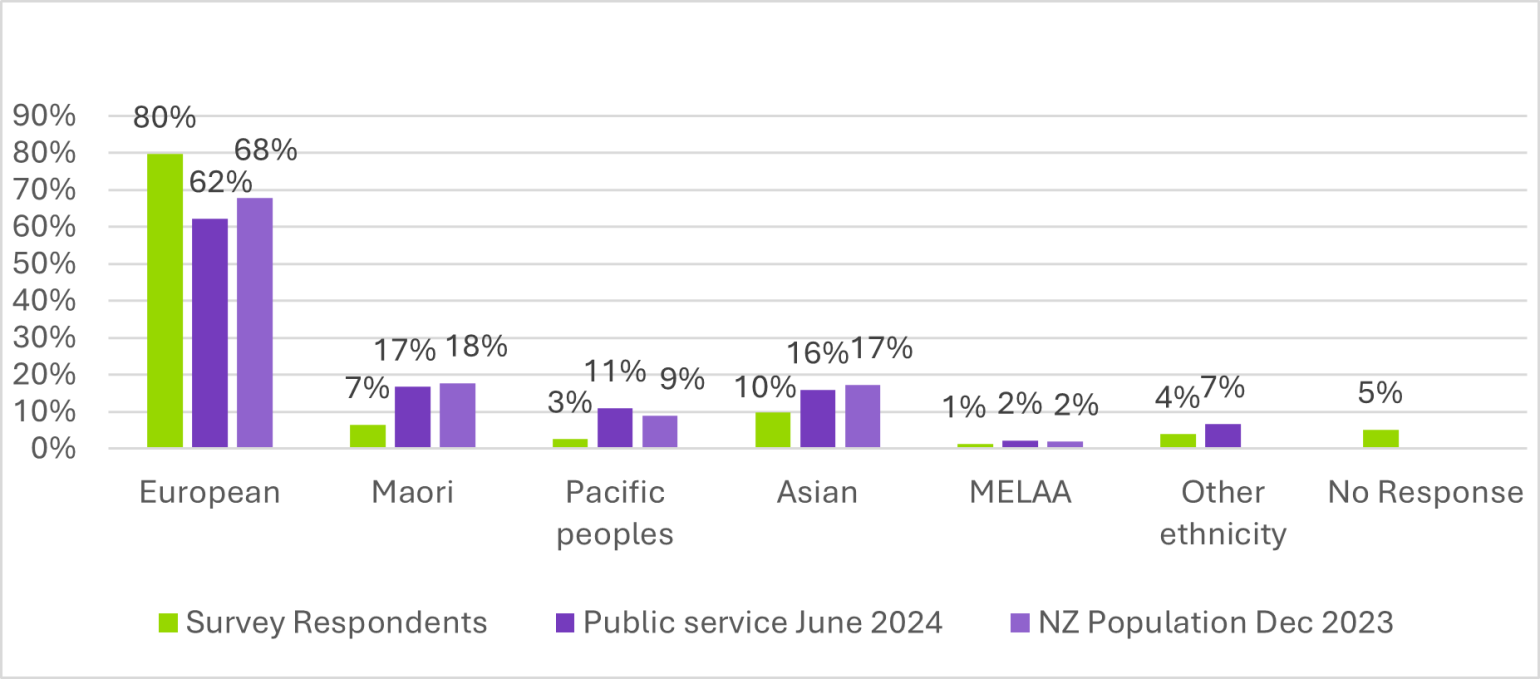
Most survey respondents identified as European, showing a clear majority in the data. People from other ethnicities, especially Māori and Pacific Peoples, are significantly underrepresented within the procurement profession.

Ethnicity comparison of respondents

workforce survey comparison ethnicity respondents public service nz population
This graph compares the ethnicity of respondents between the public service and New Zealand’s population.

Text description of graph data – Ethnicity comparison of respondents

Ethnicity

Category

Percentage

European

Survey respondent

80%

European Public service June 2024 62%
European NZ population December 2023 68%
Māori Survey respondent 7%
Māori Public service June 2024 17%
Māori NZ population December 2023 18%
Pacific peoples Survey respondent 3%
Pacific peoples Public service June 2024 11%
Pacific peoples NZ population December 2023 9%
Asian Survey respondent 10%
Asian Public service June 2024 16%
Asian NZ population December 2023 17%
Middle Eastern, Latin American, and African Survey respondent 1%
Middle Eastern, Latin American, and African Public service June 2024 2%
Middle Eastern, Latin American, and African NZ population December 2023 2%
Other ethnicity Survey respondent 4%
Other ethnicity Public service June 2024 7%
Other ethnicity NZ population December 2023 No data
No response Survey respondent No data
No response Public service June 2024 5%
No response NZ population December 2023 No data


Top