Government procurement insights for the financial year 2024/2025.
Each year, government agencies spend approximately $51.5 billion annually on goods and services.
Government procurement helps create conditions for businesses to grow the economy and support community. It does this by maximising the economic benefit to New Zealand, increasing the value of every dollar spent.
It’s important procurement is done well, good outcomes are achieved, and trust in the way government agencies spend money is maintained.
![]() Over 900 submissions were received during the public consultation on the new Government Procurement Rules.
Over 900 submissions were received during the public consultation on the new Government Procurement Rules.
The Rules have been updated with a focus on economic growth, more transparency, and strengthened accountability. The changes enable a stronger procurement system and are a direct response to feedback from stakeholders. Government agencies will publish their procurement policies, including how they will create opportunities for Aotearoa New Zealand businesses.
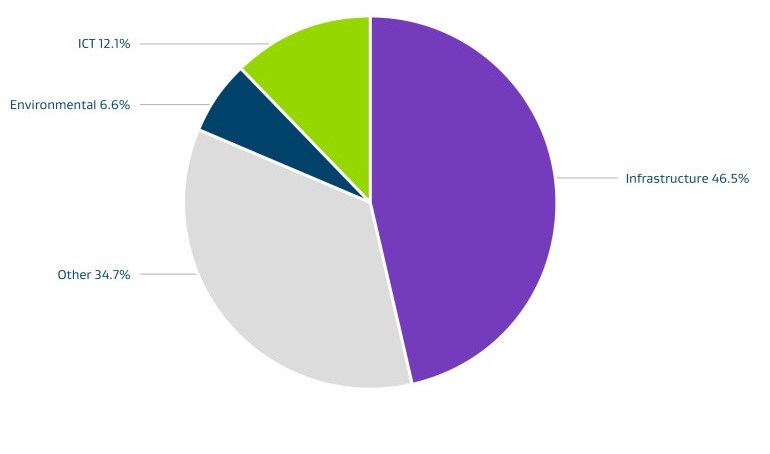
Industry categories:
ICT refers to tenders sourcing digital solutions, software, hardware, managed services, and technical consultancy.
Infrastructure covers both services and equipment. For example, the delivery of construction, maintenance, and upgrade services for public assets and facilities. It also covers the supply, installation, and sometimes maintenance of physical assets and machinery required for infrastructure projects.
Environmental tenders source services and solutions related to environmental management, monitoring, and sustainability. For example, ecological assessments, waste management, pest control and water quality monitoring.
The Other category covers a wide range of tenders that do not fit into the categories above. These may include procurement of office supplies, cleaning services, catering, event management, consultancy, research equipment, and miscellaneous goods and services. This also covers social services tenders that deliver community-focused programs and support services.
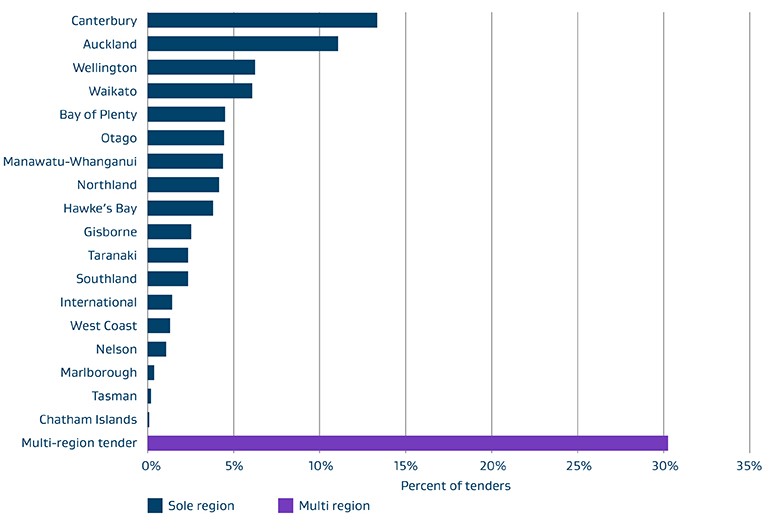
In FY24/25:
Agencies can decide how to approach the market or provider community - open competitive processes, closed competitive sourcing, direct sourcing or competitive dialogue.
The option they select to approach the market or supplier community will differ depending on the nature of the service, value, and length and size of the market.
|
Competition type |
% of total competitions type |
Average bids per competition type |
|---|---|---|
|
Closed Competition |
43.10% |
3.4 |
|
Open Competition |
56.90% |
6.7 |
Options for approaching the market
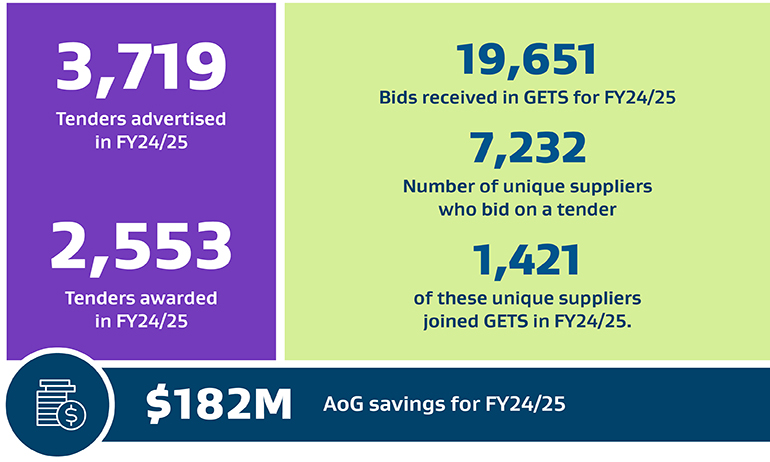
56.9% of the 3,719 tenders were open competition. Open competition attracts on average 6.7 responses (bids) per tender and closed competition averages 3.4 responses (bids) per tender.
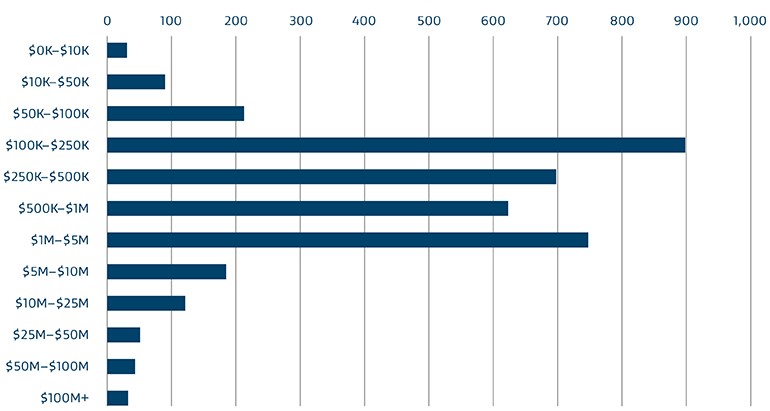
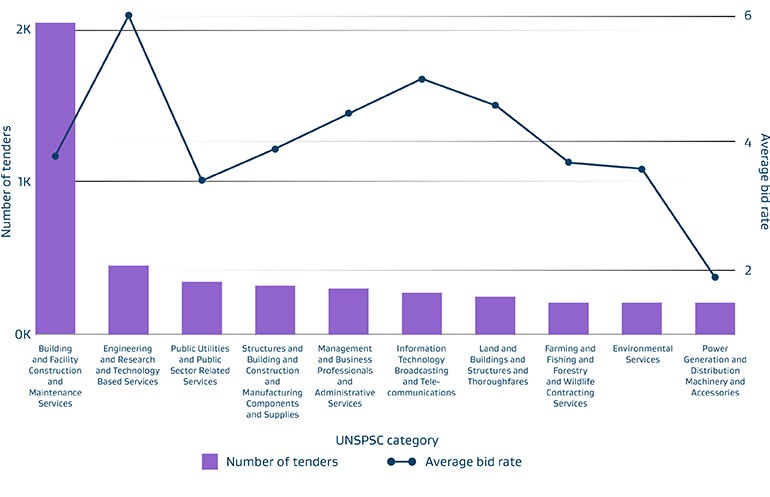
When an agency advertises a tender opportunity in GETS, they must tag the listing with the appropriate United Nations Standard Products and Services Code (UNSPSC) categories. These 10 categories received the most bids during FY 24/25.
![]() $3.2 billion spent and $182 million saved with All-of-Government (AoG) contracts.
$3.2 billion spent and $182 million saved with All-of-Government (AoG) contracts.
![]() 2,339 agencies (including schools) accessed AoG contracts.
2,339 agencies (including schools) accessed AoG contracts.
![]() 1,057 suppliers delivering goods and services through AoG contracts.
1,057 suppliers delivering goods and services through AoG contracts.
![]() 1,239 AoG contracts signed by agencies.
1,239 AoG contracts signed by agencies.
Disclaimer: The savings reported are indicative savings only (exclusive of administrative fees). Indicative savings refer to an estimate of the savings that an agency may accumulate over a certain period of time based on their spend. These savings are calculated based on various factors, such as discounts to Base Market Rates.
We continue to strive for greater transparency in government procurement. Quality data analysis informs better decisions.
We’re implementing changes to the Government Electronic Tender System (GETS) to enhance data quality and encourage more consistent use by agencies. Our aim is to improve visibility of procurement activities and deliver robust insights across the public sector.
The most significant transformation is the arrival of our e-platform, ‘Procure Connect’. It will automate processes and simplify access to procurement services and information.
This platform supports government objectives, and mitigates potential risks with data, transparency, and technological shortcomings. Once fully operational, Procure Connect will be a quick, efficient, and secure connection between markets and government.
Procure Connect — Procure Connect
We’re committed to uplifting procurement capability across the system.
Our people are our greatest asset. Supporting their capability development enables the delivery of better public value to New Zealanders. Understanding the present and future workforce helps us identify skill gaps and building practitioner confidence in responding to changing needs.
![]()
The procurement workforce is highly experienced with over half of the respondents (56%) having over 5 years of procurement experience.
58% of survey participants reported overall job satisfaction.
![]() 39% of managers hired contractors in the past year due to skill shortages (62%) and limited staff availability (45%).
39% of managers hired contractors in the past year due to skill shortages (62%) and limited staff availability (45%).
![]()
The top 5 learning needs identified by managers and individuals in the survey were: AI, procurement software and tools, innovative approaches and technology, market analysis and supplier research, and dispute resolution.
This information was collected from our 2025 workforce planning survey:
We support agency procurement through our Advisory and Business Services team, Account Managers, and we are committed to growing procurement and commercial capability across government.
![]() 75 registered members in the Procurement Community of Practice, across a range of agencies including councils, universities and agencies. Discussion forums with over 40 live conversations held on a variety of procurement related topics.
75 registered members in the Procurement Community of Practice, across a range of agencies including councils, universities and agencies. Discussion forums with over 40 live conversations held on a variety of procurement related topics.
This year our Community of Practice groups have grown. Discussions and shared experiences provide meaningful insights into the procurement ecosystem.
We collaborate with people to help design our products and services. For example, this year agencies have contributed to a new procurement competency framework. These tools will help all practitioners build their skills and knowledge to support them in their procurement roles.
Develop your procurement skills
Our Advisory and Business Services team has supported both government agencies and businesses. We’ve helped with a range of queries: from questions around application of the Rules, to helping with the Treasury’s Better Business Cases process, through to high level commercial advice and planning.
To strengthen the procurement sector, we promote and uphold best practices, provide pathways into the profession, and facilitate learning.
In FY24/25:
![]() Our Advisory and Business Services team supported over 300 procurement planning queries.
Our Advisory and Business Services team supported over 300 procurement planning queries.
20 Business cases were reviewed by the Advisory and Business Services team.
![]() 80+ risk profile assessments/strategy assessments were supported by the Advisory and Business Services team.
80+ risk profile assessments/strategy assessments were supported by the Advisory and Business Services team.
![]() Over 3800 Hīkina users across 300 agencies (including schools)
Over 3800 Hīkina users across 300 agencies (including schools)
![]() On average 180 attendees per monthly Knowledge Hour
On average 180 attendees per monthly Knowledge Hour
Average of 700 attendees at Rules implementation webinars.
![]() 14 in-person procurement workshops across the motu, with around 260 participants.
14 in-person procurement workshops across the motu, with around 260 participants.